
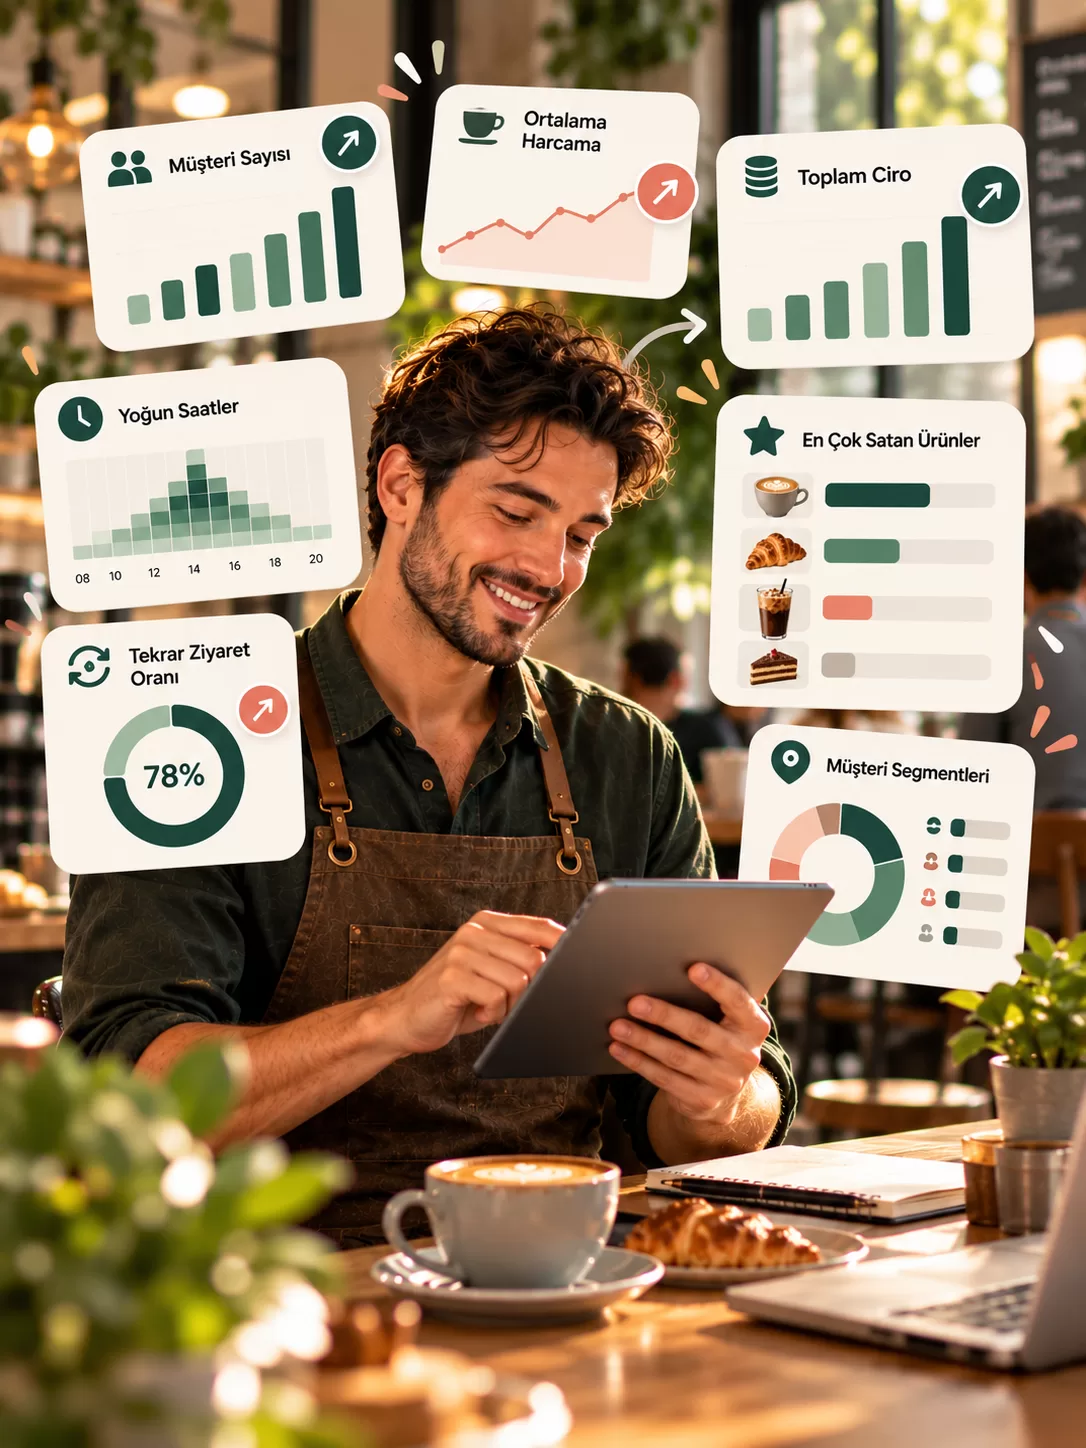
Most café owners close the day by looking at the revenue on the POS. Revenue matters, but it's an outcome; it doesn't tell you why. When revenue drops, is it because fewer customers came, the average ticket got smaller, or your regulars stopped coming? To understand that, you need to look at the numbers that make up revenue. These are the coffee shop KPIs worth tracking.
1. Daily customer count
Not how many receipts were issued, but how many customers came in. Track weekdays and weekends, and each location, separately. A sudden drop usually points to an outside cause (roadworks, a new competitor).
2. Average ticket size
Revenue ÷ number of transactions. Growing your average ticket size is often easier than finding new customers: suggesting a dessert with the coffee, pairing offers and a good display case all grow the ticket.
3. Repeat customer rate
What percentage of this month's customers also came last month? This is the most direct measure of loyalty. It's easy to measure for customers who pay or collect loyalty rewards digitally; with paper cards and cash it's almost impossible.
4. Visit frequency per customer
How many times a month does a customer come? Raising frequency from once a week to twice a week means doubling the revenue from that customer. Stamp cards, streak rewards and subscriptions target exactly this number.
5. Hourly traffic
At which hours of the day is the counter overflowing, and at which is it empty? Busy hours call for speed (ordering ahead, QR payment); quiet hours call for campaigns. Staff scheduling should be based on this number too.
6. Sales and profitability by product
The best seller isn't always the most profitable item. Put each item's units sold and unit profit side by side. For items that sell a lot but earn little, review the price or the cost; for those that sell little but earn a lot, review their visibility.
7. Prepaid balance
If you use a digital wallet, track the amount customers have topped up but not yet spent. For you, this is revenue collected in advance; in your accounts it should also be tracked as a customer advance. This number shows the effect of top-up campaigns most clearly.
8. Customer satisfaction
Average rating and number of complaints, broken down by topic and location. A drop in ratings usually comes before a drop in revenue; it's an early warning sign.
How to track these cafe metrics
- Look weekly: Daily numbers fluctuate; the weekly trend is more meaningful.
- Compare with the same period: Compare October not with September but, where possible, with October last year.
- Little but regular: You don't need to check all eight numbers every day. A 15-minute review once a week is enough.
- Tie each number to a decision: Ask of every number, "What will I do if it drops?" A number that doesn't lead to a decision only satisfies curiosity.
In short: revenue shows the outcome; these eight numbers show the cause. Customer count, average ticket, repeat rate, frequency, hourly traffic, product profitability, prepaid balance and satisfaction: a business that tracks them regularly spots problems before they grow.
In the sipnik dashboard, wallet, order, loyalty and feedback data are reported by location, and product intelligence shows which items suit which customers. If you'd like to see an estimate with your own numbers, the Sip Your Brand! shows the monthly impact instantly.
Skip setting all this up piece by piece.
Wallet, loyalty, subscriptions and order-ahead come ready for your brand.
Sip Your Brand!